


What is a Pivot Table?
Pivot tables are one of the most powerful and useful features in Excel. With very little effort, you can use a pivot table to build good-looking reports for large data sets.
A pivot table provides an interactive view of your data. With very little effort (and no formulas) you can look at the same data from many different perspectives. You can group data into categories, break down data into years and months. Moreover, you can filter data to include or exclude categories, as well as build charts.
What are the key Pivot Tables benefits?
- Simplicity. Basic pivot tables are very simple to set up and customize. There is no need to learn complicated formulas.
- Speed. You can create a good-looking, useful report with a pivot table in minutes. Even if you are very good with formulas, pivot tables are faster to set up and require much less effort.
- Flexibility. Unlike formulas, pivot tables don’t lock you into a particular view of your data. You can quickly rearrange the pivot table to suit your needs.
- Accuracy. As long as a pivot table is set up correctly, you can rest assured results are accurate. In fact, a pivot table will often highlight problems in the data faster than any other tool.
- Formatting. A pivot table can apply automatically apply consistent number and style formatting, even as data changes.
- Filtering. Pivot tables contain several tools for filtering data. Need to look at North America and Asia, but exclude Europe? A pivot table makes it simple.
- Pivot Charts. Once you have a pivot table, you can easily create a pivot chart.
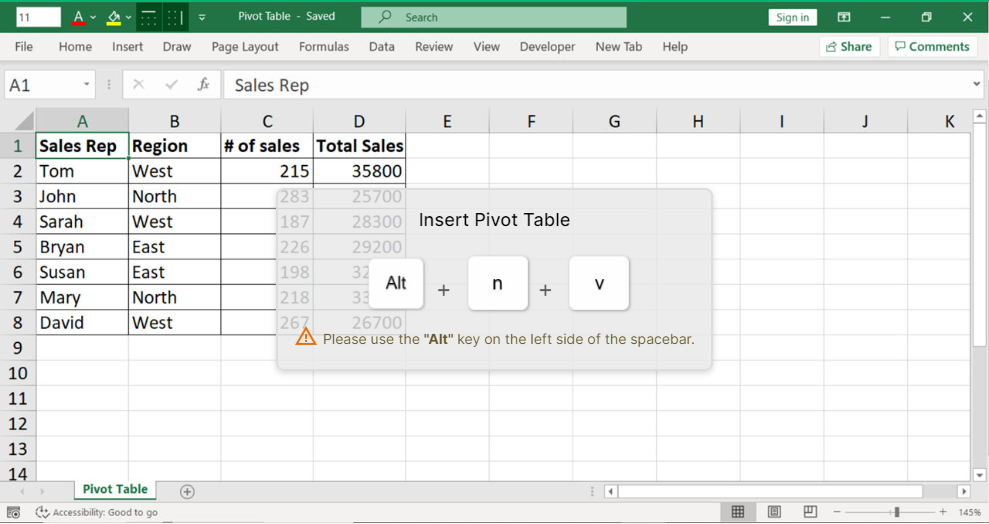
How to create Pivot Tables?
To create a pivot table, your cursor should be on a table you’d like to use for that. Then you can use Excel shortcut Alt N V to insert a pivot table.
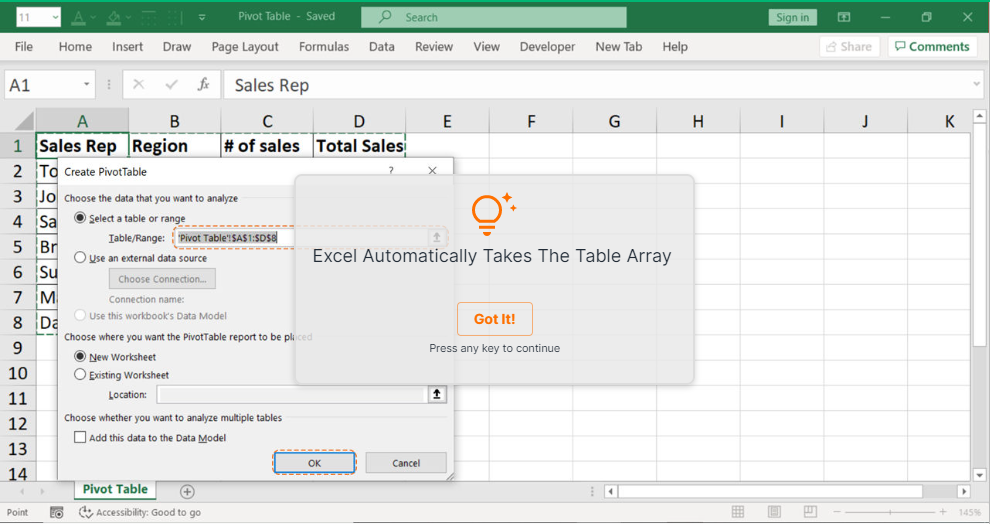
Excel automatically grabs a table array. If you would like to change it, you can do it here.
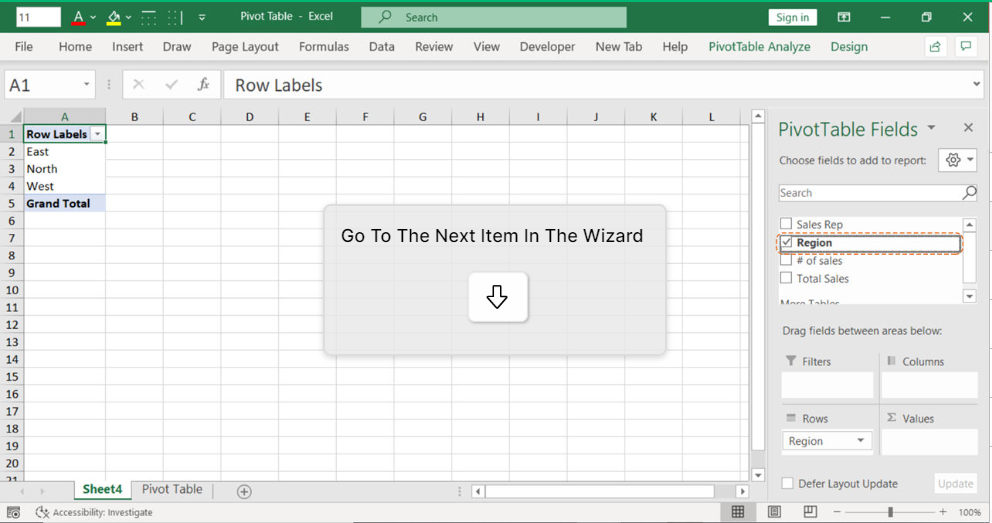
Pivot table would be created in a separate Excel sheet and empty will look like in the picture below. From here you can play with your data and create different pivot tables considering your needs and goals.
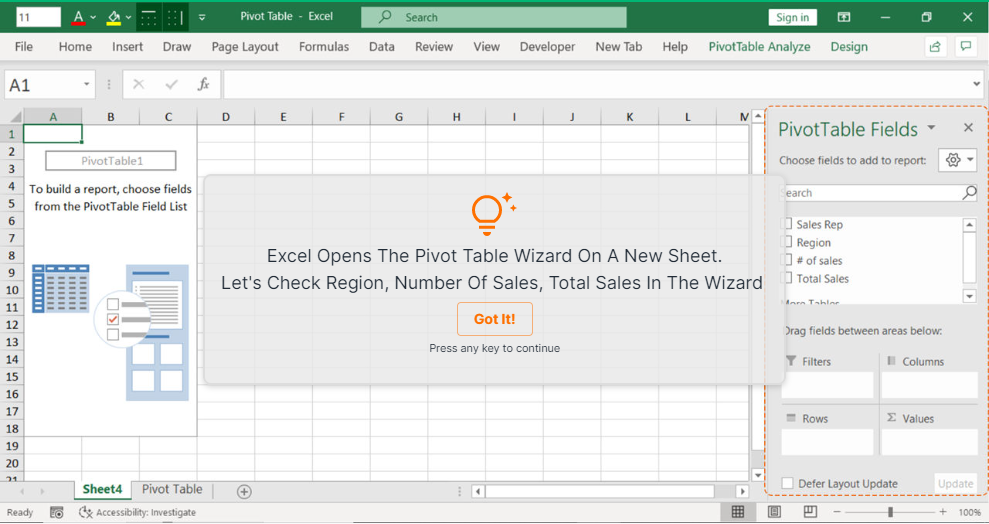
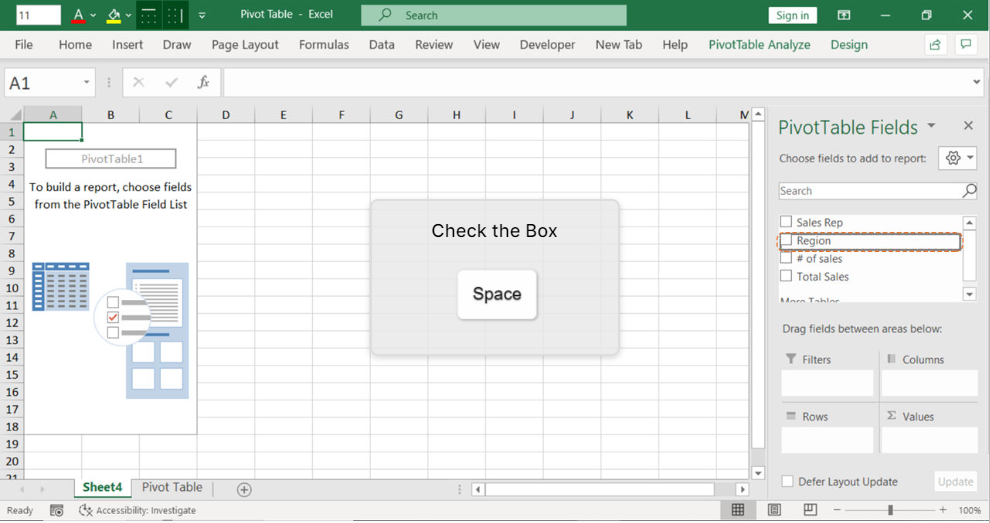
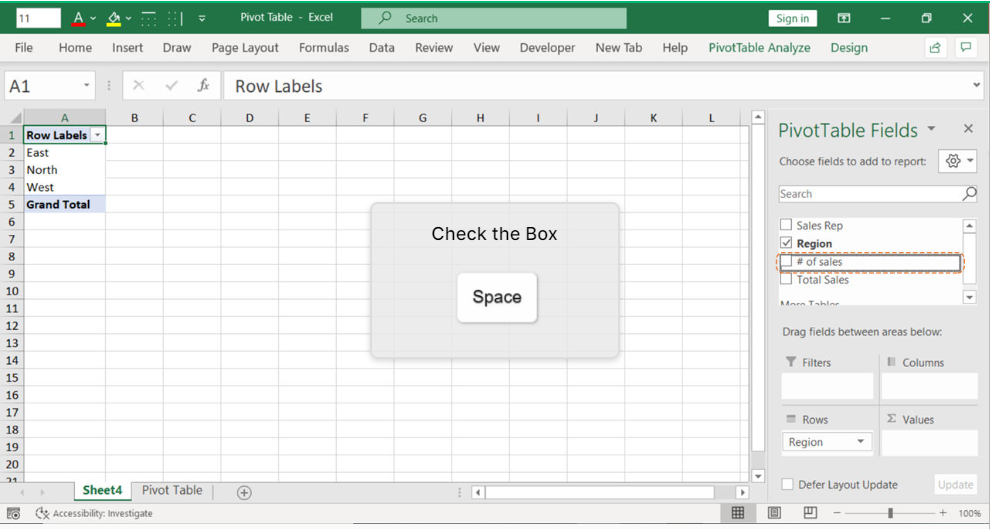
Let’s say we want to see “Region”, “# of sales” and “Total Sales” in our table. For that, let’s check the relative boxes on the right. You can do it by using “Spacebar” as an Excel shortcut to check the box.
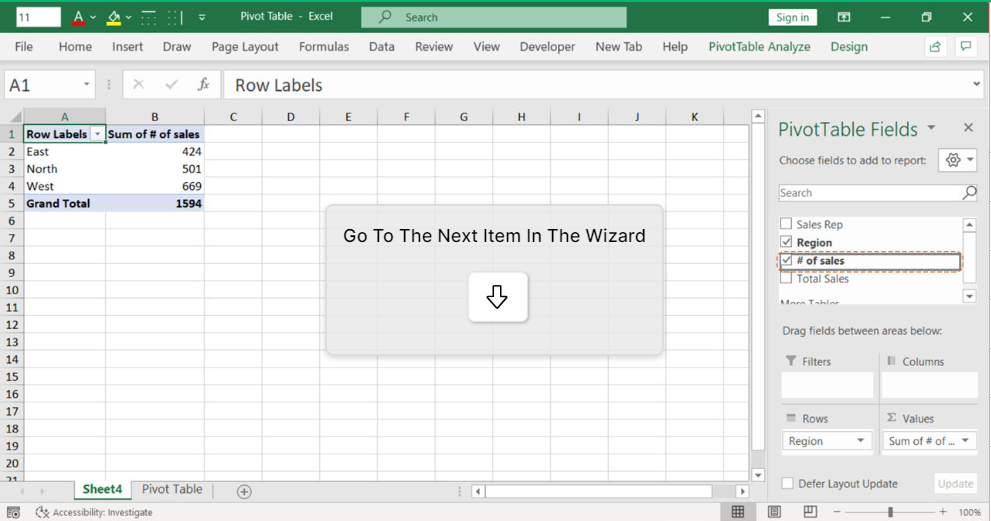
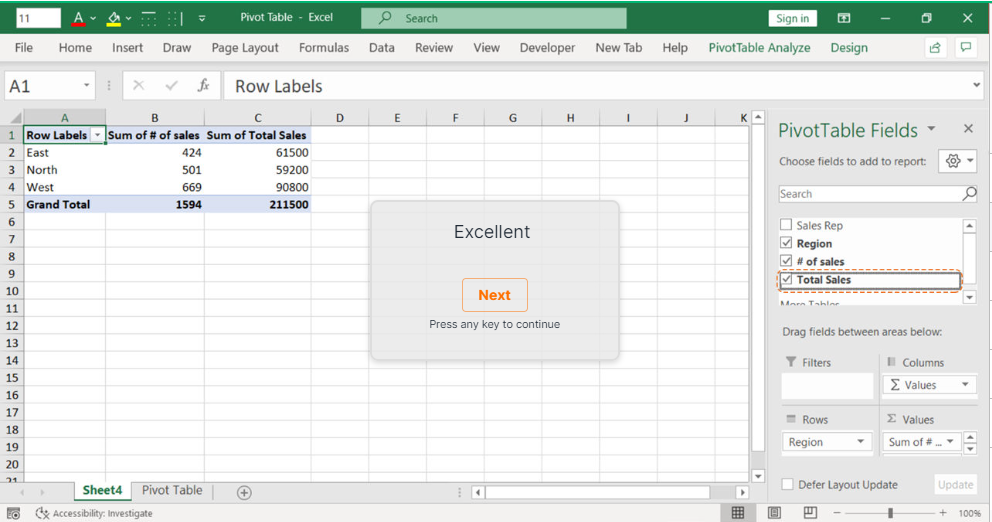
Our Pivot Table is ready. We can modify it by changing Pivot Tables Fields on the right.
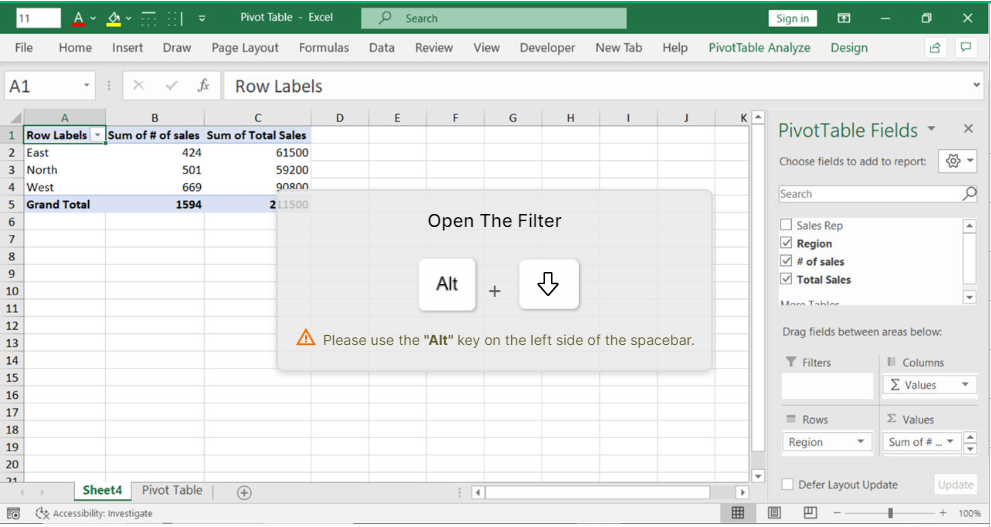
How to Filter in Pivot Tables?
Any pivot table would include filters in it, so you can pick necessary information and easily play with your data set. Alt + Down Arrow would open a filter for you mouse-free.
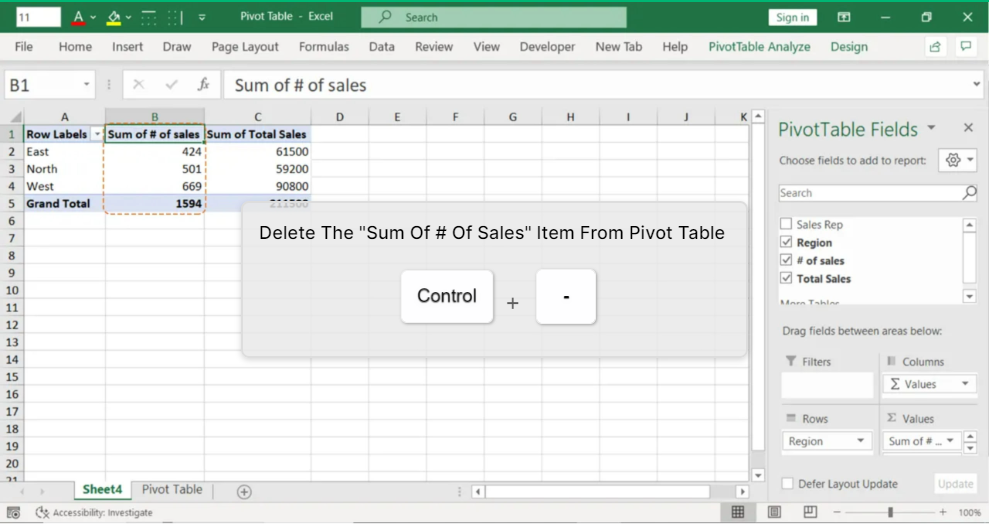
What is the Pivot Table Shortcuts?
To delete the column mouse-free, put your cursor on the relative column, and use Excel shortcut Ctrl + ‘-’.
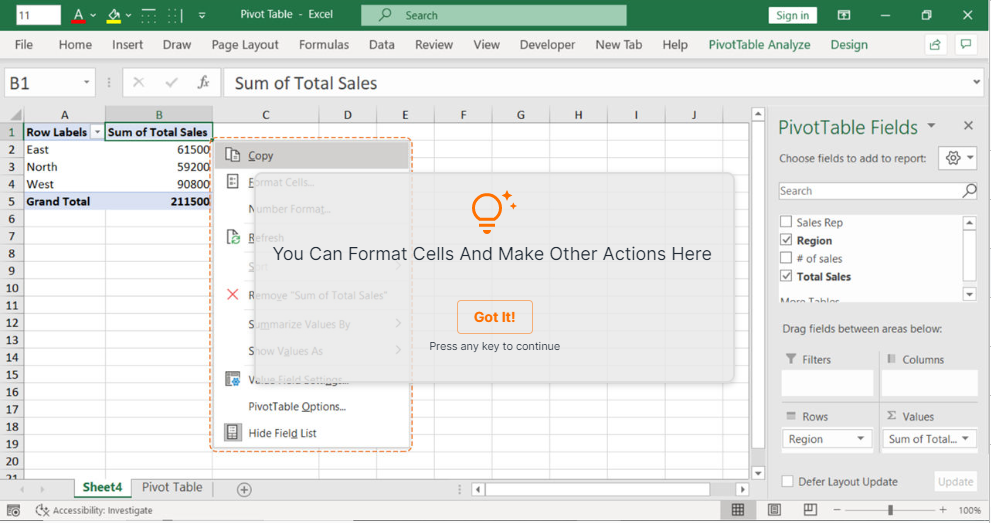
To open the Right-Click with the mouse menu without using your mouse, use Excel shortcut Shift + F10.

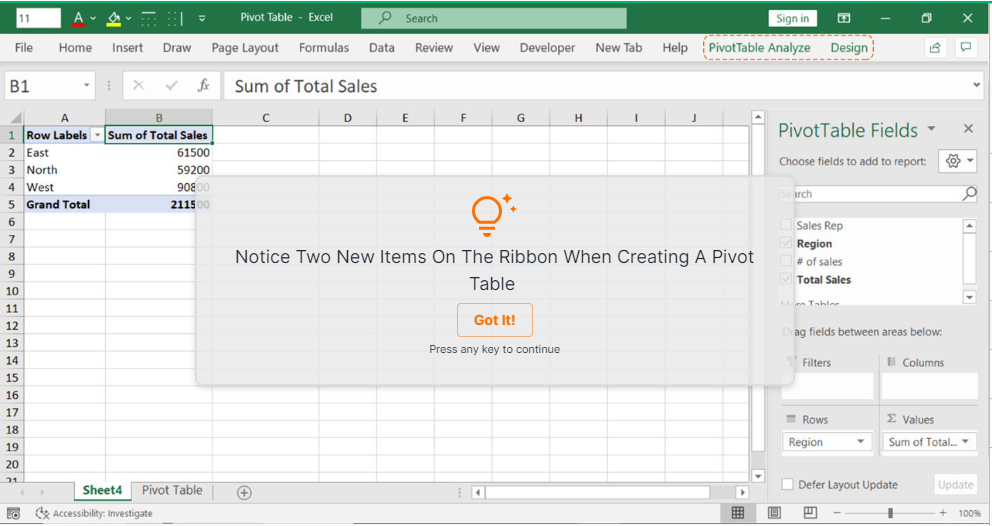
What are Pivot Table Analyze and Design Settings?
When working with pivot tables, you will have extra tabs on your ribbon called “Pivot Table Analyze” and “Design”.
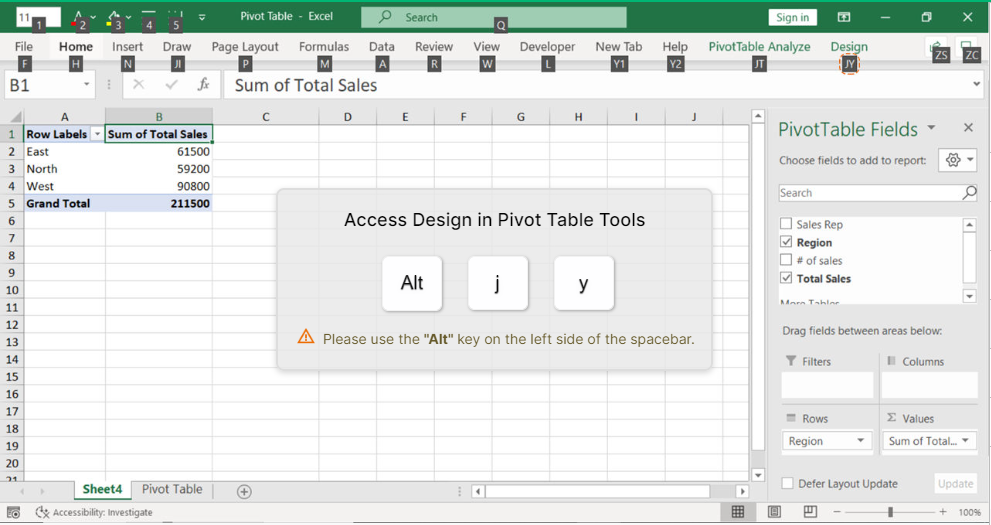
To access the “Design” tab, you can use shortcut Alt J Y.
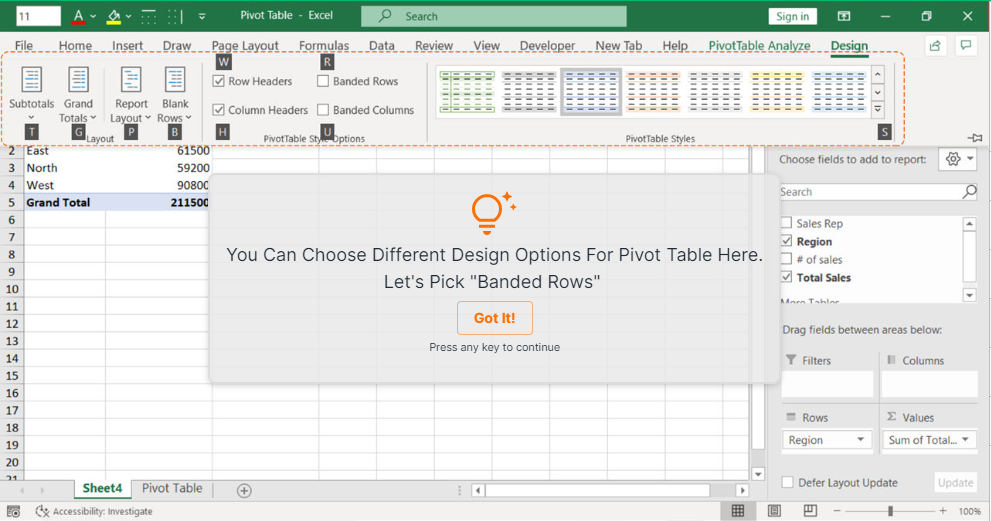
You can choose different design options for your pivot table here. For example, is we want to pick “Banded Rows”, we would click “R” as shown on the Ribbon.
Then our pivot table with banded rows will look like shown on the picture below.
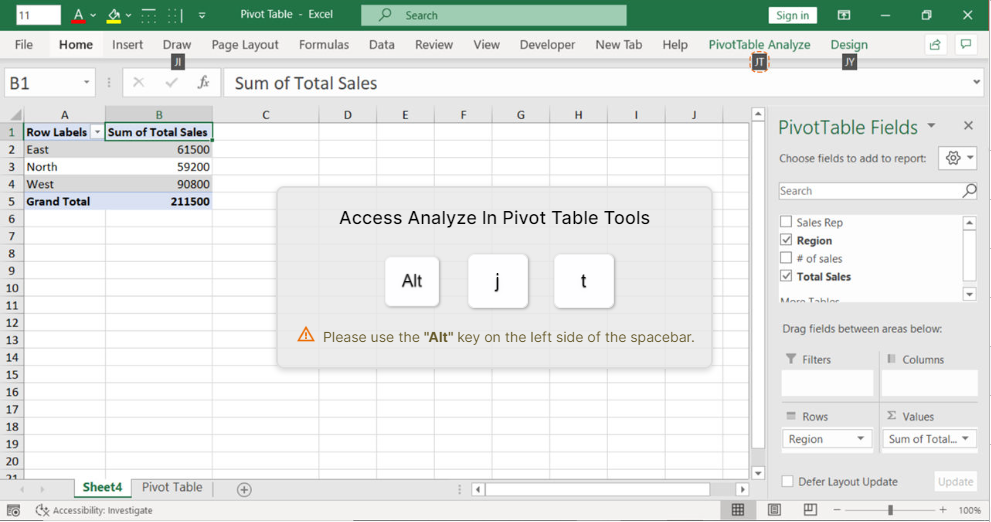
To access the “Pivot Table Analyze” tab, you can use shortcut Alt J T.
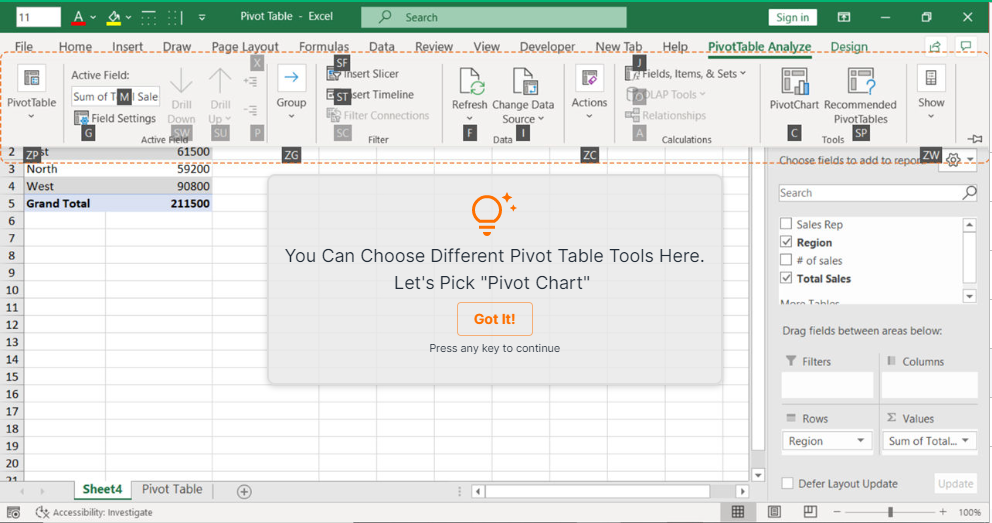
You can choose different pivot table tools here. Let’s pick “Pivot Chart”, for that we need to click “C” as shown on the Ribbon.
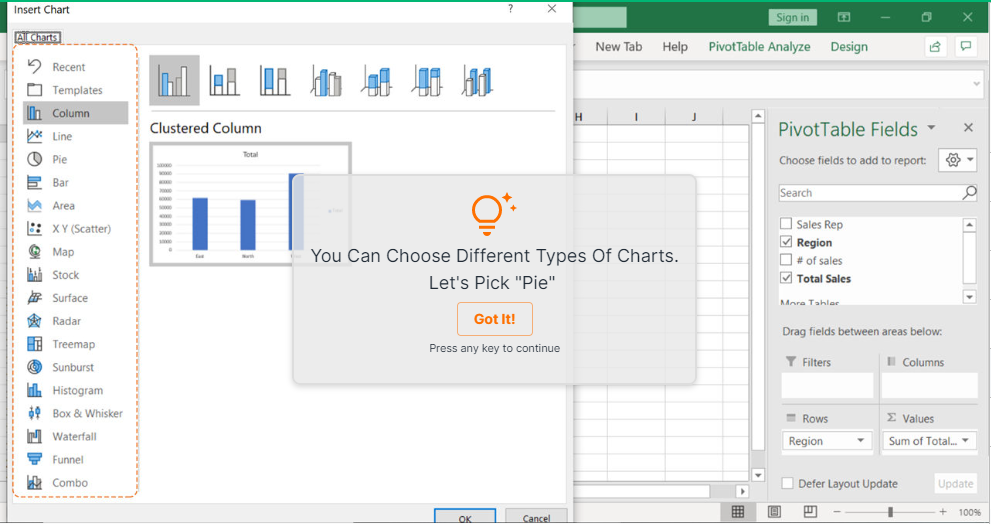
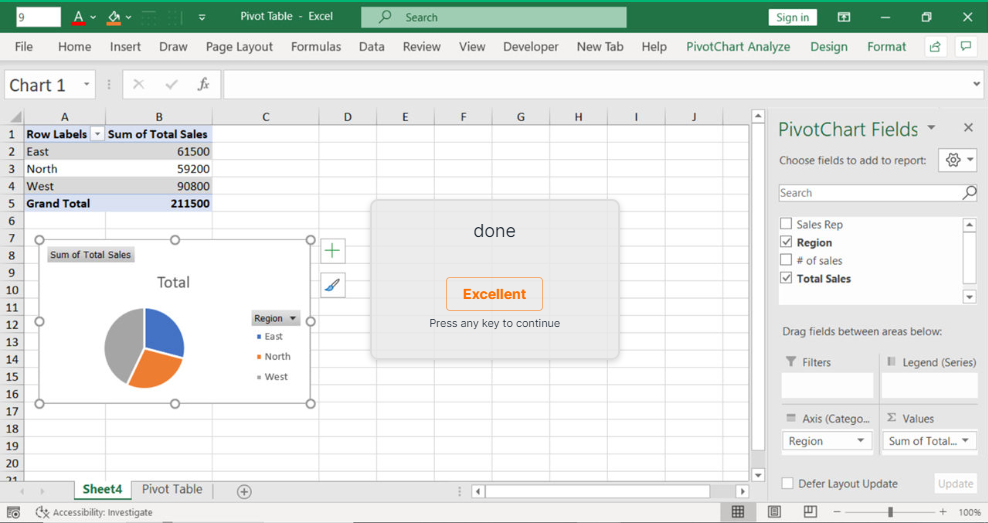
You can choose different types of charts here. Let’s pick pie chart for our example.
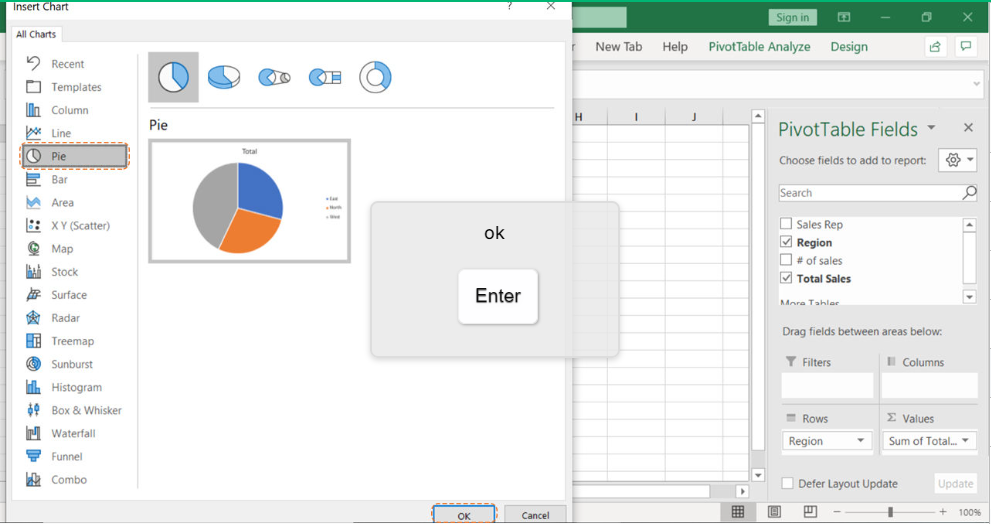
You can play with you chart further here by changing the colors and other looks using the panel to the right from the chart. Ctrl will open those chart elements for you mouse-free.
Conclusion
A Pivot Table is a powerful tool to calculate, summarize, and analyze data that lets you see comparisons, patterns, and trends in your data easily. The beauty of pivot tables is they allow you to interactively explore your data in different ways.
Learn more Excel functions and speed up your Excel workflow and Financial Modeling skills by playing our educational games keySkillset.
.jpg)
.jpg)

.jpg)
.jpg)


.png)

